What is CoinAtlas?
CoinAtlas is a company that offers a portfolio tracker for stocks and cryptocurrencies through a Google Sheets template, enabling users to monitor their investments conveniently and efficiently.
Will CoinAtlas gain access to my sensitive information, such as my current holdings?
No, users are required to make a copy of the template, and CoinAtlas will not have access to the user's personal copy. If users choose to share their spreadsheet for any reason, any shared information will be treated with the utmost confidentiality. CoinAtlas will never sell your information to third parties.
What is the difference between the "Basic Edition" and the "Premium Edition"?
You can find the differences between these two editions outlined on the homepage in the pricing section.
What is the difference between FIFO and LIFO?
FIFO (First In, First Out) and LIFO (Last In, First Out) are two distinct accounting methods used to calculate realized gains. You can learn more about the differences and potential tax implications here.
How do I switch between FIFO and LIFO?
To switch between FIFO and LIFO, go to the CoinAtlas menu, choose "Build Report," and then select either "FIFO" or "LIFO" as desired.
I need to create a tax report. Where can I find the necessary information for this task?
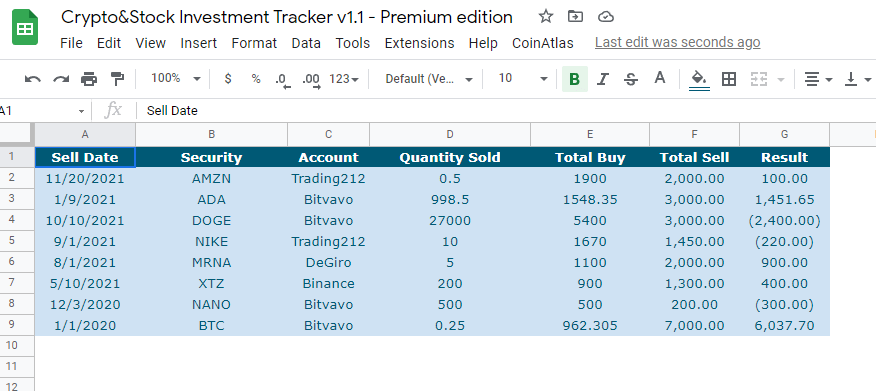
To access the necessary information for tax reporting, go to Menu > View > Hidden sheets > Report. This will reveal a sheet called "Report," containing essential data such as total purchase cost (Total Buy), total sales amount (Total Sell), and profit or loss made.
Is it possible to filter the tax report based on dates?
Currently, date-based filtering is not available, but it will be implemented in the future. However, there is a workaround:
- Select the second row of the History sheet and click the "filter" icon.
- Click the arrow next to "Date" and sort the history sheet in ascending order.
- Duplicate the history sheet.
- Delete the data you wish to filter in the original history sheet (e.g., delete all inputs before and after the year 2020).
- Run the build report function.
- Access the "Report" sheet for the tax report, which now contains filtered data.
- Once finished, copy/paste the data from the duplicate history sheet back to the original history sheet and rerun the build report function.
The cryptocurrency I am tracking is outside the top 100 of CoinMarketCap. How do I extend the list to include those outside the top 100?
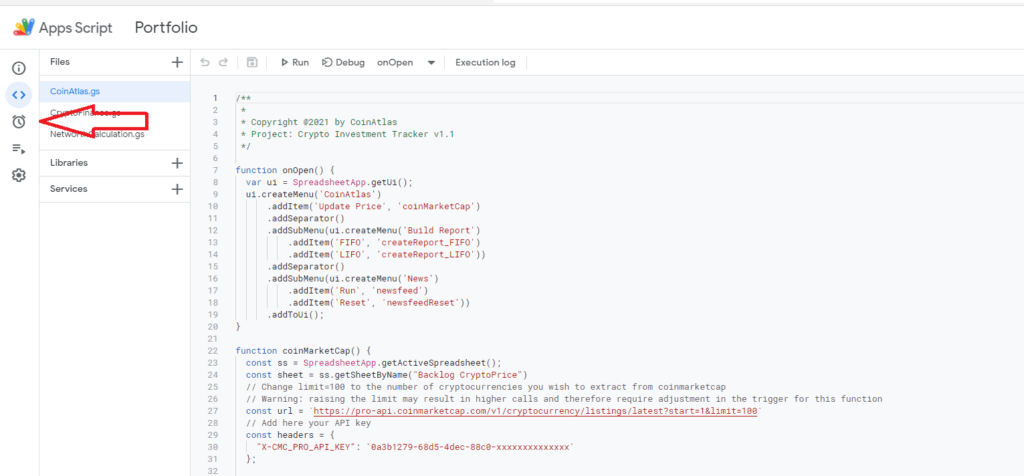
To extend the list, modify the limit inside the CoinMarketCap function (Menu > Extensions > App script > CoinAtlas > CoinMarketCap function). Specifically, in "const url = https://pro-api.coinmarketcap.com/v1/cryptocurrency/listings/latest?start=1&limit=100," change limit=100 to another limit, e.g., 500. Note that this increases your calls per day, so you might need to adjust the trigger for this function accordingly. See other FAQs for more information.
How do I adjust the triggers for the functions?
To adjust the frequency of the automated updates, go to Menu > App Script > NetworthCalculations > createTimeDrivenTriggers. Here you can change the frequency from the default setting of every 5 minutes to any desired interval. For example, you can change the CoinMarketCap trigger to update every 15 minutes by modifying "everyMinutes(5)" to "everyMinutes(15)" and then saving the project.
How do I account for fees in the history sheet?
To accurately reflect the impact of fees on your holdings, fill in both the quantity and the total price paid for the asset, which includes any associated fees. If you have lost cryptocurrencies due to costs associated with transferring them from one account to another (e.g., wallet to exchange), use the action "CryptoTransfer" as instructed below in this FAQ.
What is the difference between the action "Withdrawal" and "CryptoTransfer" in the history sheet?
The action "Withdrawal" is used to calculate the amount of cash per account. The action "CryptoTransfer," on the other hand, is used to account for any cryptocurrencies that were lost due to transfer fees. For instance, if you paid 0.01 ETH in gas fees when transferring your holdings from your wallet to your exchange, enter 0.01 as the quantity and leave the total empty when using the "CryptoTransfer" action. In the "Positions" sheet, which displays all of your current holdings, 0.01 ETH will automatically be deducted from the total.
How do I account for a stock split in the history sheet?
To properly reflect a stock split, use the action "Stock Split" in the history sheet. Be sure to enter the correct date and fill in the "stock split ratio," while leaving the quantity, total, and price fields blank. If a stock split occurs at a later date, repeat this process.
I accidently clicked more than once on "activate trigger" (step 8). I am receiving an error: "Exception: This script has too many triggers" or running into my API limits! What should I do?
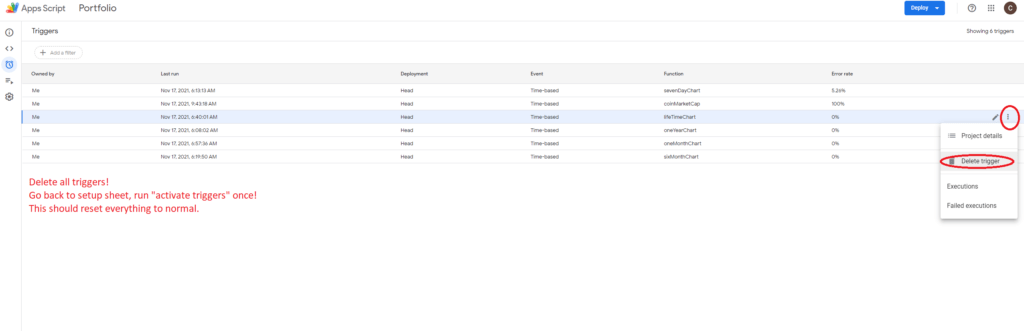
If you clicked "activate trigger" more than once and are receiving an error message such as "Exception: This script has too many triggers" or running into your API limits, follow these steps: Go to Menu>Extensions>App Script>Triggers>click on the "three dots" next to any function>delete all triggers. Go back to the setup sheet and click on "activate trigger" only once.
How is the portfolio return calculated for the categories (stock/crypto) and the entire portfolio?
The portfolio return for both the stock and cryptocurrency categories, as well as the entire portfolio, is calculated using the money-weighted average rate of return formula. You can learn more about this formula here.
Where can I find the total balance of my accounts?
To view the total balance across all of your accounts, go to the "Analysis of Portfolio" sheet and view the graph labeled "Account." Hover over the graph with your mouse to see the amount per account. To view the raw data, you can unhide the "Lookup Table" sheet through the view menu.
Am I allowed to re-arrange the columns of the History sheet?
No, re-arranging the columns in the History sheet will break the calculations required to run the build report script. It is best to leave the columns in their original order.
The spreadsheet does not fit well on my screen. How do I change this?
To adjust the size of the spreadsheet to fit your screen, use the "zoom" function located below the menu. While the spreadsheet may work well on a 27-inch monitor, it may not fit properly on a smaller laptop screen.