Kickstart your journey with this premium tracker
This guide pertains to the “Premium Crypto Investment Tracker v1.1.” As newer versions are released, this page will be updated accordingly. To learn more about this update, explore my other page. For any lingering questions, consult the FAQ after reading this guide.
Welcome to the CoinAtlas Investment Tracker, designed specifically for cryptocurrencies. This powerful tool offers essential features, such as net worth tracking, tax reports (FIFO/LIFO), CoinMarketCap API integration, and accounting for lost cryptocurrencies during transfers (e.g., from wallet to exchange). With this tracker, you can efficiently manage your investment portfolio and stay informed with the latest news through the integrated NewsFeed.
This guide is divided into two sections: the first outlines the tracker’s setup, while the second offers a comprehensive overview of key sheets. My aim is to help every user maximize their spreadsheet experience.
Follow these steps in the setup sheet to set up your tracker:
- Step 1: Input your data in the account box (up to 30 entries), including different brokers and exchanges. Do not remove CryptoTransfer!
- Step 2: Navigate to the History sheet, observe the data entry format, and use cryptocurrency symbols like “BTC” for bitcoin. Delete columns A through E, leaving column F to calculate the average price based on purchase costs and coin quantity. Erase columns G and H, then populate the History sheet with your transaction data, including fees, provided by your broker or exchange.
- Important Note: If your broker offers crypto-to-crypto conversion rates (e.g., BNB/BTC) instead of crypto-to-fiat, find the historical fiat price at the conversion time and use it for transactions in the spreadsheet. For instance, if you converted 10 BNB into 0.05 bitcoins on 03/01/2021 at 13:00 using Binance, search their website for the historical price of 10 BNB (which equals 2100 euros). In the spreadsheet, first record the sale of 10 BNB at a total cost of 2100 euros, then input a separate transaction to purchase 0.05 BTC at the same total cost of 2100 euros.
- Step 3: Access Menu > CoinAtlas > Build Report > LIFO/FIFO (learn about the tax implications here). Authorize by clicking continue > select your Gmail account > advanced > go to the portfolio (unsafe) – a standard procedure for running any script!
- Step 4: Choose your desired currency (e.g., USD or EUR) for portfolio output in the “Main currency” box.
- Step 5: Within the cryptocurrency box, you will discover a comprehensive list of your owned cryptocurrencies, displayed in column “I.” Kindly input the respective slug for each cryptocurrency in column “H” and the corresponding symbol or currency in column “J,” emulating the given example. Please note that the information in columns “H” and “J” is crucial for the effective utilization of the “Watchlist” feature.
- Step 6: Register at coinmarketcap and retrieve your personal API key from here. Go to Menu>App Script>CoinAtlas. Insert your personal CoinMarketCap API key within the “coinMarketCap” function, specifically in the following location: “X-CMC_PRO_API_KEY”: ‘fbe6a0e0-xxxx-xxxx-xxxx-xxxxxxxxeec9′”.
- Step 7: With your history complete, manually input today’s date (avoid the =TODAY() function). This will initiate lifetime net worth tracking.
- Step 8: Click “activate triggers” to start running the functions that monitor your net worth. Remember, only click the trigger once! If clicked multiple times, you’ll need to remove the triggers manually (refer to FAQ for details).
- Step 9: Optional: Update cryptocurrency price data in the custom menu as needed; otherwise, the function will refresh every 5 minutes.
- Step 10: Optional: Enable or disable the newsfeed in the custom menu.

Additional information
- Price data is obtained from CoinMarketCap (CMC) via an API, with a daily limit of 333 calls and a monthly limit of 10,000 calls. The free plan should suffice for most users, but if you need more, you may need to upgrade to a paid plan.
- The top 100 coins on CoinMarketCap are tracked by default. If you need to track more, adjust the limit within the coinMarketCap function (Menu > App Script > CoinAtlas > coinMarketCap function). For example, in “const URL = `https://pro-api.coinmarketcap.com/v1/cryptocurrency/listings/latest?start=1&limit=100`”, change limit=100 to your desired limit, such as 500. Keep in mind that increasing the limit will also increase your daily API calls, which may necessitate adjusting your trigger for this function. Refer to the FAQ for further details.
- The “Build Report” function is a script that automatically calculates the number of shares you own for each asset and the average price you paid. When selling an investment, the script employs the FIFO or LIFO method. Once an investment’s shares are depleted, they will be automatically removed from the “Positions” sheet. This function can be helpful for generating tax reports, but use caution, as it is still in beta and not specifically designed for tax purposes.
- Upon clicking “Build Report,” all calculations in the “Positions” sheet should be automated. Ensure that the main output currency is recognizable by “Google Finance” to prevent errors. Test it in a separate cell before inputting it into the tracker.
- The tracker supports 200 cryptocurrencies by default, but you can extend the formulas to accommodate more if needed. The money-weighted-average-return (MWAR) is used to calculate your portfolio’s “total return.” Keep in mind that if your portfolio is less than a year old, the MWAR might yield inflated results. Learn more about the MWAR here.
- If the spreadsheet appears too large or small on your screen, adjust the “zoom” under “view.” For instance, a 135% zoom may be suitable for a 27-inch, 2K screen.
- By default, the tracker supports 30 accounts. To calculate account balances, deposits and sells are treated as positive cash flow, while buys and withdrawals are treated as negative cash flow. To transfer cash between accounts, record a withdrawal in one account and a corresponding deposit in the other. If you need to track more than 30 accounts, you can extend the formulas yourself or contact me for assistance.
Description of spreadsheet
Dashboard
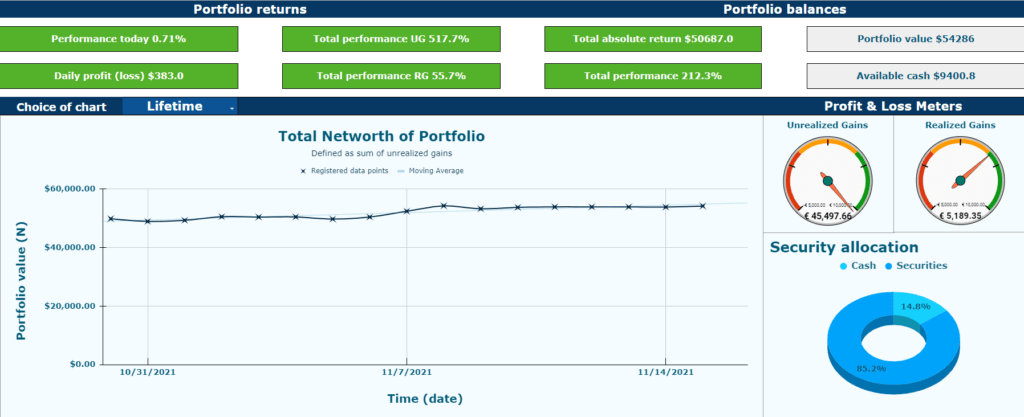
The Dashboard serves as the central hub for a summary of crucial portfolio data. It displays daily performance in absolute terms, percentages, total unrealized gains, and realized gains. Moreover, you’ll find your current cash and account balances at the top right. The middle-right section shows the total unrealized and realized gains in absolute terms.
Metric explanations
- Performance today: daily profit or loss as a percentage of the total portfolio
- Daily profit (loss): daily profit or loss in local fiat currency
- Total performance UG: unrealized gains performance across your portfolio
- Total performance RG: realized gains performance across your portfolio
- Total absolute return: combined realized and unrealized gains
- Total performance: calculated for the entire portfolio using the money-weighted rate of return formula
- Portfolio value: total value of current holdings
- Available cash: combined cash balance across all accounts
- Unrealized gains: profit (or loss) sum for all current holdings
- Realized gains: profit (or loss) sum for all sold holdings, either completely or partially
Your total net worth is recorded twice daily after the initial setup day. Data is unavailable before the first recording day.
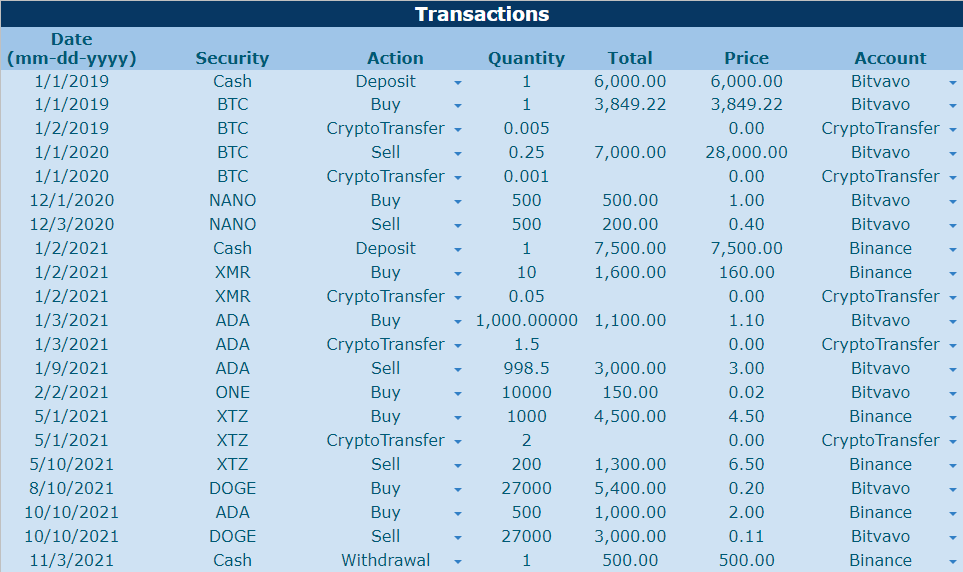
History
The History sheet requires user input and serves as the foundation for calculations throughout the tracker. To modify the tracker, adjust the History sheet’s input data rather than altering formulas.
Report & Summary of RG Report
The “Report” sheet assists in tax report generation, displaying information such as date, quantity, purchase cost, and total sell price for each sold asset. The “Summary of RG Report” offers a condensed version of the “Report” sheet. Avoid making changes to these sheets.
Portfolio Analysis
This sheet offers a visual representation of your investments to inform future decisions. Analyzing allocations within your portfolio can provide insights into whether rebalancing is necessary. Moreover, evaluating investment accounts’ allocations and market cap size distribution can yield valuable information.
Investor Return
The Investor Return sheet displays returns for one holding period. Use the drop-down list in cell “H4” to toggle between realized and unrealized gains. The dynamic graphs update based on changes to the “History” sheet and the drop-down list selection. The first chart displays individual asset gains or losses, while the second chart shows portfolio returns. The final charts are gauge meters that reflect total return based on the money-weighted rate of return.
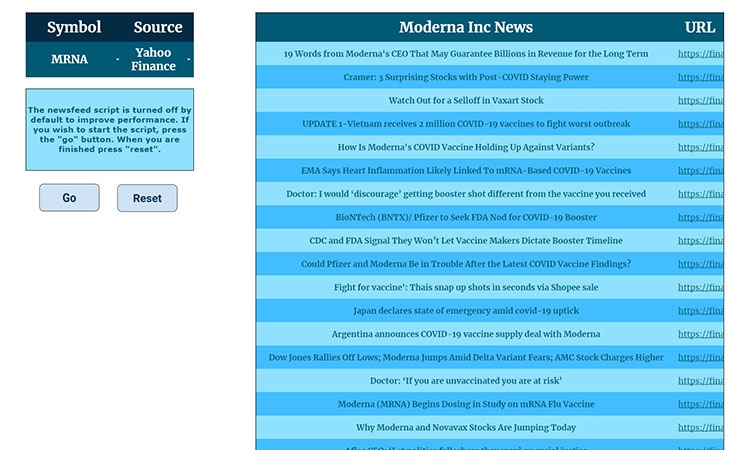
Newsfeed
Access the 20 most recent articles from “Cointelegraph,” “Coindesk,” or “CryptoNinjas” by changing the value in cell “B7.”
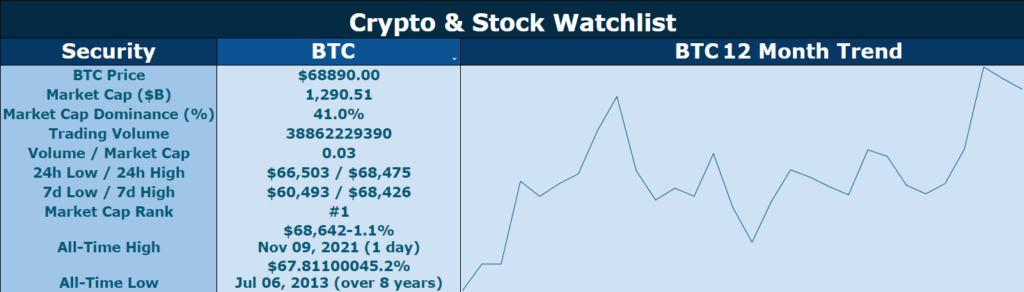
Watchlist
The watchlist tool helps monitor your current holdings’ performance. Select any holding in cell “C6” to view relevant price action information for the asset.
3 Comments
1billionlinks · December 23, 2022 at 8:11 am
Hey there, I think your website might be having browser compatibility issues.
When I look at your blog site in Chrome, it looks fine but when opening in Internet Explorer, it has some
overlapping. I just wanted to give you a quick heads up! Other then that, excellent
blog!
Buy press releases · February 17, 2023 at 2:40 pm
Heya i’m for the first time here. I found this board and I find It truly useful & it helped me out much.
I hope to give something back and help others like you
helped me.
Pashtun · April 13, 2023 at 7:56 pm
Glad to hear it helped you!